
 Share This Page
| Home | | Mathematics | | Signal Processing | | | Share This Page |
A practicum on Fourier analysis and signal processing
— P. Lutus — Message Page —
Copyright © 2008, P. Lutus
(double-click any word to see its definition)
The basic idea of signal processing is that a complex, time-domain waveform like this —
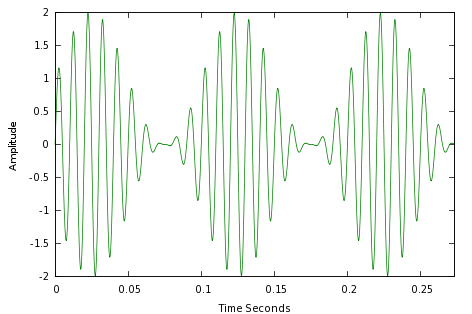
— can be fully and completely recreated using a frequency-domain representation like this:
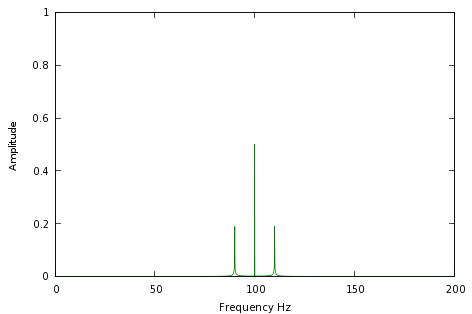
It's difficult to overemphasize the significance of this transformation. Graph 1 above represents an old-style AM ("Amplitude-Modulated") radio signal, with a "carrier wave" (the center point) and some information in sidebands (the two adjacent points). In the early days of electronic technology, if you wanted to create a radio signal, you simply generated the time-varying waveform in Graph 1. If you wanted to preserve a hour's worth of the signal, you were obliged to record the waveform in Graph 1 for an hour.
Here is another use for signal processing. Let's say some aliens are trying to send us the secret to eternal happiness, but because they live many light-years away, their signal is unreadably weak, buried in noise like this:
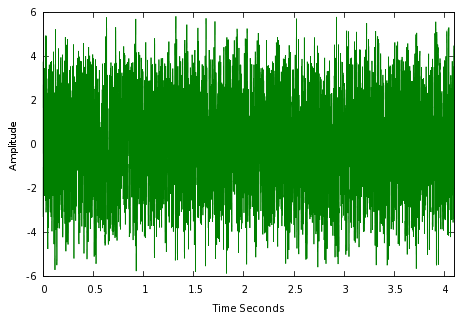
This looks like an impossible task — even though the aliens might tell us something interesting, because of the noise we don't even know they're trying to reach us. But we can use signal processing to convert the original time-domain signal into a frequency-domain representation —
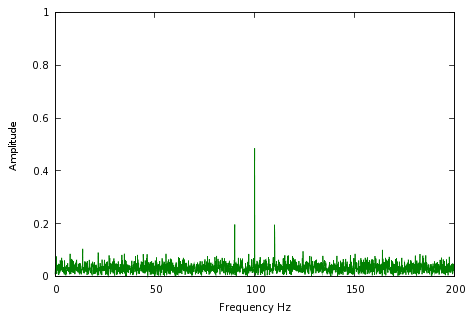
— and the alien signal pops right out of the noise. By the way, this is exactly how SETI (the Search for Extraterrestrial Intelligence) searches for alien signals, and it is why they need lots of computer power to accomplish their mission.
A number of natural phenomena can be modeled and predicted using signal processing methods, and one of these is ocean tides. Tides follow a complex repetitive pattern with an interplay of daily, monthly and yearly cycles, which makes the signal processing methods described in this article an ideal data reduction technique.
First, tidal observations for a particular location are collected and placed in a data set that correlates tidal heights with time. Then a Fourier Transform is applied to create a compact representation of the original data. Just as in the earlier examples, the compact representation contains within it the essence of the original wave pattern, but in a much smaller size, and with the important property that the original waves can be modeled for any time in the past or future. Finally, an inverse Fourier Transform is applied to the compact form to provide a tidal prediction for a particular time and place.
Here is an example prediction:
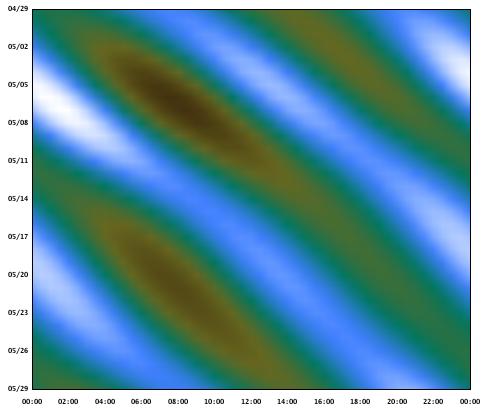
(horizontal and vertical axes). Source: JTides
In this example, three axes of information are provided — date (vertical axis), time (horizontal axis) and tidal height (colors). This diagram was created using a program (JTides) that relies completely on the Fourier signal processing methods described here. Because of the efficiency inherent in Fourier processing, a relatively small program can be relied on to provide worldwide tidal forecasts for a period of decades.
Le's say we want to save bandwidth in a communication channel by transmitting the absolute minimum of information required to reproduce a television picture (which is just a complex radio signal as in Graph 1 above). In the early days of television, one often saw a TV test pattern like this:
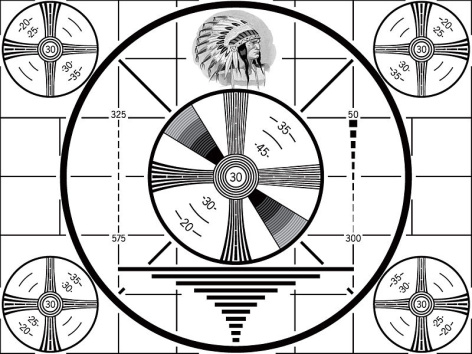
In the original TV system, to transmit this image across the airwaves, it was necessary to send the exact same information 30 times per second. In modern times, because of signal processing and other improvements, we are only obliged to transmit a group of mathematical values representing the original image, then we only need to transmit new values if the image changes. This is why the old analog TV system is giving way to digital — the analog system was incredibly inefficient.
| Home | | Mathematics | | Signal Processing | | | Share This Page |