
 Share This Page
| Home | | Raspberry Pi | | | Share This Page |
Copyright © 2016, Paul Lutus — Message Page
Most recent update: 03.02.2016
(double-click any word to see its definition)
In a full exposition provided here I explain what kinds of networking I've used over the years, including a rather exotic network based on shortwave radio that kept me in touch with civilization during my around-the-world sail.
Until recently I've had little need to directly monitor network traffic — it was usually enough that the packets seemed to be going where I intended. But as networks have gotten faster and as networking has become a more complex subject, I find myself needing to directly monitor network activity, both inside and outside my local area network (LAN).
This article describes hardware and software methods for network monitoring, from the crude early days to the present, and offers solutions to the problems involved in monitoring gigabit network traffic.
For many years the default method to monitor network activity was simple and obvious — directly tap into a network cable. Like this:

Figure 1: Classic network tap scheme (RJ45 connectors)
Using the scheme shown in Figure 1 a network engineer could monitor outgoing traffic on one tap or incoming traffic on the other, but not both. With a special monitoring computer equipped with two network interface cards (NICs) and with proper configuration, he could monitor both simultaneously, but this method was difficult to set up and use, and often unreliable.
The scheme shown in Figure 1, which assumes an Ethernet network based on RJ45 connectors and cables, directly taps into a path between network hosts/switches/hubs and directly monitors the signals. A few years ago, when "Ethernet" meant 10 megabits per second (abbreviated as Mbit/s), this direct-tap method was beginning to be unworkable because of cable reflections, standing waves and improper terminations. But in modern times a respectable network runs at gigabit-per-second (Gbit/s) speeds, and at that speed, anything but a very carefully arranged and properly terminated physical network, often based on the Cat5 cable standard, won't function at all, so a simple physical tap as shown in Figure 1 can no longer function at all.
Standing Waves
Modern network cables are in essence transmission lines and can't function without proper impedance matching and termination. Without digressing too far from our primary topic, in modern times a network cable has much in common with a cable that connects a radio transmitter to an antenna. Ideally, a radio transmitter is adjusted to match the characteristic impedance of the antenna (and the space into which the radio energy is transmitted). When this is true, the rapidly changing signals on the cable travel to the antenna and are absorbed (i.e. transmitted into space) completely, with no unused energy.
In the event of any impedance mismatch between the signal on the cable and its termination, any energy not absorbed at the cable's endpoint is reflected back along the cable, causing a standing wave. Here's an animation to show the effect (imagine the pulses traveling at near light speed) (click the image to start the animation):

Figure 2: Standing wave on transmission line (click image to play animation)
In the face of increasing network speeds, the eventual effect of cable issues and standing waves has been to eliminate simple network monitoring methods such as that shown in Figure 1. Simply put, a modern network won't tolerate something as crude as a hardware tap to monitor packets.
To explain why this is true, I ask my readers to consider what a Gigabit data rate actually means. It literally means 1x109 bits per second.In order to provide data at this rate, the Gigabit scheme (formally 1000BASE-T) uses multiple conductors, multiple voltage levels, and a clock speed of 125 MHz. And unlike a radio or TV transmitter, the bandwidth of a Gigabit communications channel is very wide, in essence extending from 0 to 125 MHz, and intolerant of any significant distortion. No wonder we can't directly tap network cables ay more.Digression: How much data is that? Well, 1x109 bits is:
- 125 million eight-bit characters, which is
- 25 million five-character words, which is
- 100,000 pages each of 250 words, which is
- 400 books, each of 250 pages.
Four hundreds books per second. Imagine if modern network traffic really was composed of books, books we might enjoy reading, rather than cute cat pictures and spam.
Hubs and Switches
But for a spell, this change didn't prevent alternative, relatively easy monitoring methods. After the direct hardware tapping method was abandoned, one could acquire a cheap network hub for monitoring purposes. A network hub by definition ties all its ports in parallel so each port sees what the others see.
The good news about network hubs is that they're simple and economical and they allow monitoring of all the traffic flowing through. The bad news is that, as the number of ports increases, the number of packet collisions increases and the network's overall speed declines. These factors, plus a dramatic decrease in the cost of network hardware, has virtually eliminated network hubs and replaced them with switches.
A network switch is a more sophisticated device that internally routes packets only from their source to their intended destination, rather than broadcast them to all connected ports as in a hub. This greatly speeds up the network and avoids nearly all collisions, but it has the side effect of preventing packet monitoring. One cannot use a switch to examine any packets other than those with a source or destination at the monitoring computer.
But all is not lost — read on for a relatively inexpensive, elegant solution.
Some currently available — and inexpensive — network switches have sophisticated management features, including the ability to mirror one port onto another. A port mirror configuration represents an updated version of the old network tap, but with many advantages. One is that it eliminates the standing wave problem created by an open tap. Another is that the mirror can be configured to monitor both sides of a network conversation simultaneously, eliminating one of the more complex parts of the old method.
To set the stage for a monitored network, here's a typical home / small business network:
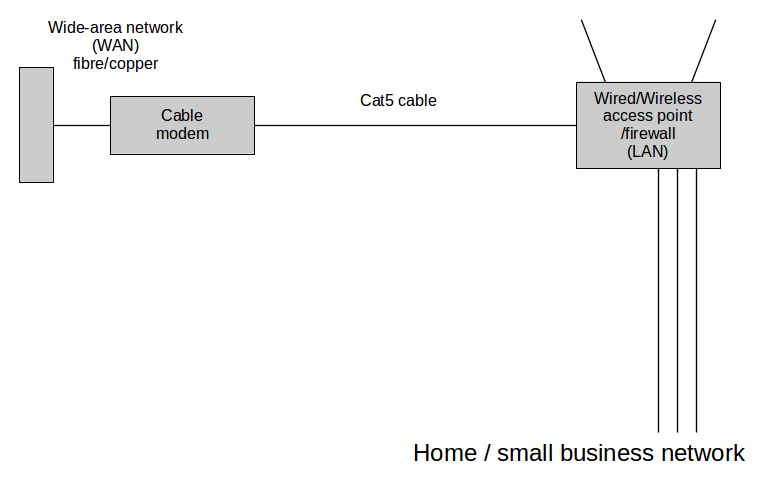
Figure 3: Home/ small business network
With respect to the access point at the upper right of Figure 3, until recently I had a wireless access point that I could flash with OpenWRT (thereby making its internals accessible and modifiable), install a program named tcpdump, and use a method described below to monitor all network communications. But that access point died, and recent political changes seem to suggest that future access points won't be modifiable by end users. My new router/access point (a TP-Link Archer C5) happens not to have a compatible OpenWRT version, and it's rumored that TP-Link is in the process of changing their firmware to prevent the flashing of third-party software.
Rather than try to fight these changes I've decided to try to get along without modifying the firmware in available routers. This decision has a number of aspects — most third-party replacement firmware sacrifices some router features in exchange for access, and my primary reason to modify a router was to allow packet monitoring on the WAN side, which I now realize I can do another way.
Here's a network with my new monitoring scheme in place:
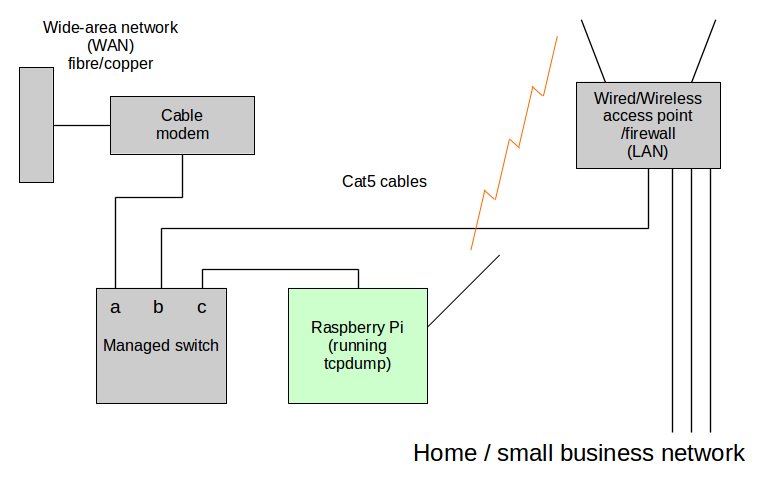
Figure 4: Home/ small business network with traffic monitoring
Here are some details:
- The managed switch I'm using (lower left of Figure 4) is a TP-Link TL-SG108E, which has a built-in Web server to handle management tasks. I emphasize I'm not endorsing this product, and I'm sure there are many similar products on the market able to mirror one port onto another. Such switches aren't very expensive — I got mine for US$35.00.
- The Raspberry Pi (bottom center of Figure 4) provides a communications link between the special monitoring area and the firewalled side of my network. The Pi does this with two network interfaces — the RJ45 Ethernet port that's part of the product to monitor the WAN side, and a USB wireless network adaptor to establish a connection on the LAN side.
- The TP-Link switch can be configured to mirror any of its ports onto one where the Pi is connected. The Web-based configuration display looks like this:
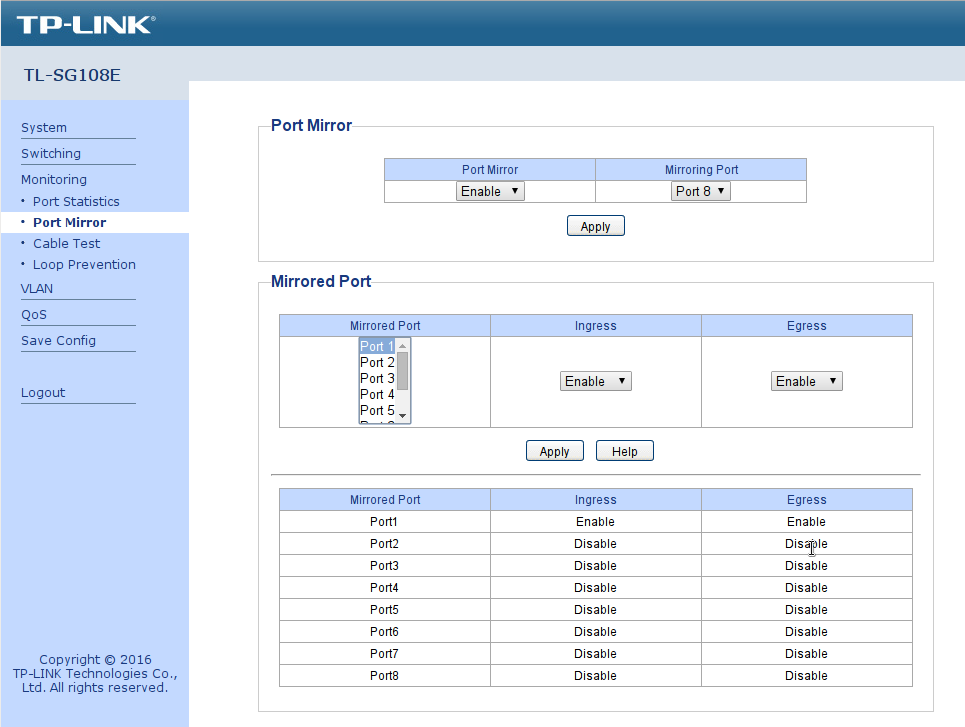
Figure 5: TP-Link Web-based management page
- Once this configuration is in place and power is applied, the Pi uses its USB wireless adaptor to negotiate a connection with the local wireless access point, thereby becoming visible on the LAN. Its Ethernet port is exposed to the data flowing through the managed switch, which includes some external WAN traffic (i.e. all traffic with a local origin or destination, plus broadcast traffic).
- In the final step, described more fully below, a shell script activates tcpdump on the Raspberry Pi and pipes the resulting data stream to Wireshark running on a desktop machine for display and analysis.
The physical installation looks more or less like this:
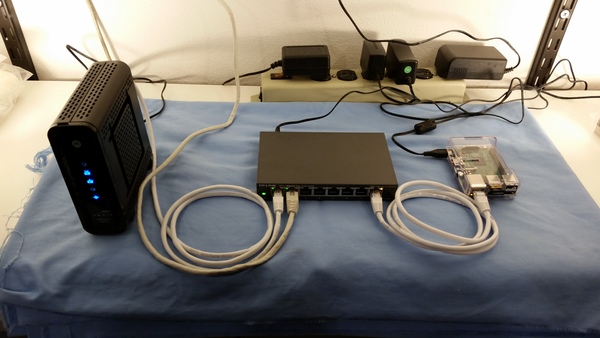
Figure 6: Physical layout of network monitoring scheme
- Left: Generic cable modem (left-side white cable)
- Above, out of view: Local network wireless access point (tan cable rising out of view)
- Center: TP-Link TL-SG108E gigabit managed switch
with port mirroring feature- Right: Raspberry Pi 2 Model B with USB wireless adaptor (right-side white cable)
Before moving on, I want to say this is a perfect application for a Rasperry Pi. The Pi is inexpensive, it runs Linux, it's acessible using Secure Shell, and utilities like tcpdump can be very easily installed. It's small and inexpensive enough that I could apply it to a job like this and not notice its absence elsewhere — and if I did, I would just buy another one.
The basic idea of this scheme is to separate packet collection from analysis and display. The packet collection is accomplished by a strategically located Raspberry Pi, in a configuration described in the previous section, and the analysis/display is accomplished on any machine connected to the local network. In fact, multiple displays can be supported — each launches its own copy of tcpdump on the Pi to sample the data stream.
Raspberry Pi preparation
The Raspberry Pi is prepared by installing any suitable Linux distribution (there's no need for a graphical user interface for this specific role), configuring it so that it can be accessed by Secure Shell without having to enter a password (see these instructions), then installing tcpdump:
# apt-get update
# apt-get install tcpdump
To be able to monitor packets using tcpdump via SSH, we need to log into the Pi as root, so change this line in /etc/ssh/sshd_config:
PermitRootLogin yesBefore disconnecting the Pi from a keyboard and display, it might be wise to log the Pi onto your local wireless access point and provide a password, a step that is normally only required once. This will allow the Pi to boot up and connect itself to the local wireless network unattended.
Desktop/laptop preparation
A desktop/laptop machine running Linux (the instructions below assumes a Debian-derived Linux version) is prepared by first installing Wireshark:
# apt-get update
# apt-get install wireshark
The above straightforward installation won't work on all distributions (some require the addition of a Wireshark PPA to proceed), and most installations require these additional steps after the basic installation to allow user-level packet capture (this is a normal configuration step for local Wireshark packet monitoring, it's not actually needed for the Raspberry Pi data pipe scheme):
# dpkg-reconfigure wireshark-commonThe above should produce this dialog:
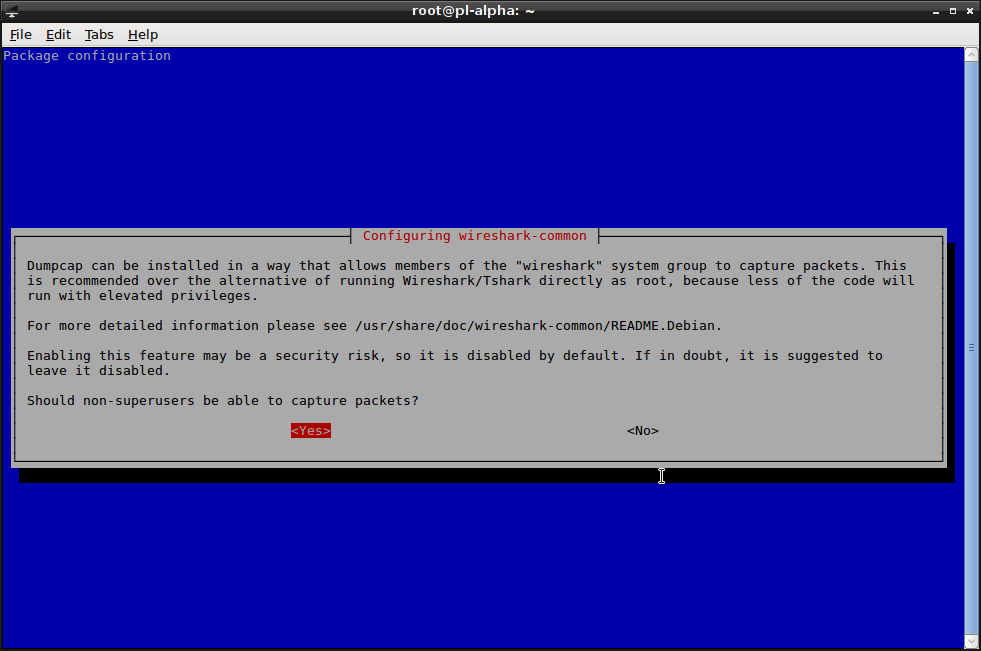
Reply with "Yes" in most cases. Then your user must be made a member of the wireshark group:
# usermod -a -G wireshark usernameLog out and back in after the above step to establish your presence in the wireshark group.
Setup and test
In this scheme, the user launches a shell script that pipes packet data (via Secure Shell) from the Pi to a local instance of Wireshark.
Obviously instead of running Wireshark one could simply dump the captured packets into a shell session and interpret them on the fly, but I doubt many will volunteer for this display method. But as a preliminary step, just to test the circuit and assuming all prior steps have been completed, one can issue this command (as a normal user, not as root):
$ ssh root@(Pi network name or IP) tcpdump -i eth0A word of explanation. This command is issued locally under user authority, but root authority is needed at the Raspberry Pi to monitor packets using tcpdump. This is the same pattern used in the shell script described below — root authority at the Pi, user authority locally.
Possible errors:
- If the system responds with "could not resolve hostname", make sure you have your Pi's correct local network name or IP.
- If the Secure Shell client asks for a password, go back up this page and repeat the instructions for establishing a passwordless login.
- If the system responds with "tcpdump: command not found", you need to install tcpdump on the Pi.
- If the system responds with:
but then goes silent, there's a problem with the configuration of the switch and/or its connection with the Pi.tcpdump: verbose output suppressed, use -v or -vv for full protocol decode listening on eth0, link-type EN10MB (Ethernet), capture size 262144 bytes(The above error list is by no means exhaustive.)
Tcpdump | wireshark pipe shell script
Assuming all the prior steps have been completed successfully, we can write a shell script that automatically launches tcpdump on the Pi, wireshark on a desktop/laptop, and pipes them together for packet monitoring and analysis. Here's an example of such a script:
Click here to display and/or download the above script as plain text.
Here's an explanation of the shell script's command-line arguments:
- pipe_a : tcpdump (man page):
- -U : Don't buffer packets, emit them right away.
- -i (nic) : Specify a network interface to monitor.
- not port 22 : Optional, prevent capturing packets meant for Wireshark itself if monitoring the same nic used for the pipe.
- -w - : write to stdout
- pipe_b : wireshark (man page):
- -i - : Capture from stdin.
- -k : Start capturing immediately, i.e. don't examine local network interfaces.
In the above script, tcpdump on the Raspberry Pi is running with root authority, but Wireshark on the user side is not. It's not a good idea to run Wireshark as root.
In many recent Linux versions, the above shell script can be launched by clicking it, and if the user chooses this approach, it might be desirable to automatically open a terminal emulator when the script is clicked, using this extra line near the top of the script:
tty -s || exec xterm $0The above tests to see if the current process has a tty, and if not, it relaunches the script using xterm (or choose another terminal emulator).
My version of this project went very well with no serious problems, and restored my ability to monitor the WAN side of my network as well as all incoming/outgoing traffic from my LAN. But it occurs to me that some installations may have a problem if:
- The user's managed switch (the switch located upstream of the user's access point/firewall) has a Web-based administration facility, as mine does.
- The cable modem and/or associated network has an active DHCP server.
If both the above are true, then the switch will acquire an IP and the switch's management Web page will be exposed to the world. This outcome isn't very likely, but I mention it because if it were true, it could represent a very serious vulnerability.
To check the security of your monitoring scheme, after enabling it, log onto a remote site where you have login rights and do this:
# nmap (IP of your Internet connection)Ideally this scan should reveal no open ports. And for reasons too complicated to go into, this test must be performed after first logging onto a remote site. If it's performed locally, the results aren't valid.
I mention this port scan security check because a few months ago I made a configuration error in my prior access point — I inadvertently exposed the administration Web page to the world, then went traveling, oblivious to what was taking place at home.
The funny part about this story is that there was no chance people would be able to guess the password I chose, so they couldn't actually gain acess to my network. But that was small comfort, because word got out and people all over the world started hitting my site night and day, trying to hack in. I ended up exceeding my data cap — all based on hacker traffic, not legitimate Internet usage — from script kiddies trying to guess my password.
After I returned from my travels, I realized my error and reconfigured the access point to prevent WAN access to the configuration web page. But later, by monitoring the WAN (using a scheme like that above), I could see someone was still trying to hit my site and gain access by various methods, primarily by probing ports that had once been open but that I had closed.
After a few days of this annoyance, I reported the hacker to his ISP, and the probes ended abruptly. But (the point of this anecdote) without WAN monitoring like that provided by this article I would never have seen the attack attempts and my data usage would have been higher that it should have been and for a reason I wouldn't be able to establish.
Who's phoning home?
Another use for WAN monitoring is to see what apps and services are phoning home for reasons you may not like. Nothing evaporates my enthusiasm for a new application more quickly then to launch it and see a sudden, large data stream open up between my site and the manufacturer's site. My point is that this is something one can't easily establish without WAN monitoring.
Thanks for reading!
| Home | | Raspberry Pi | | | Share This Page |